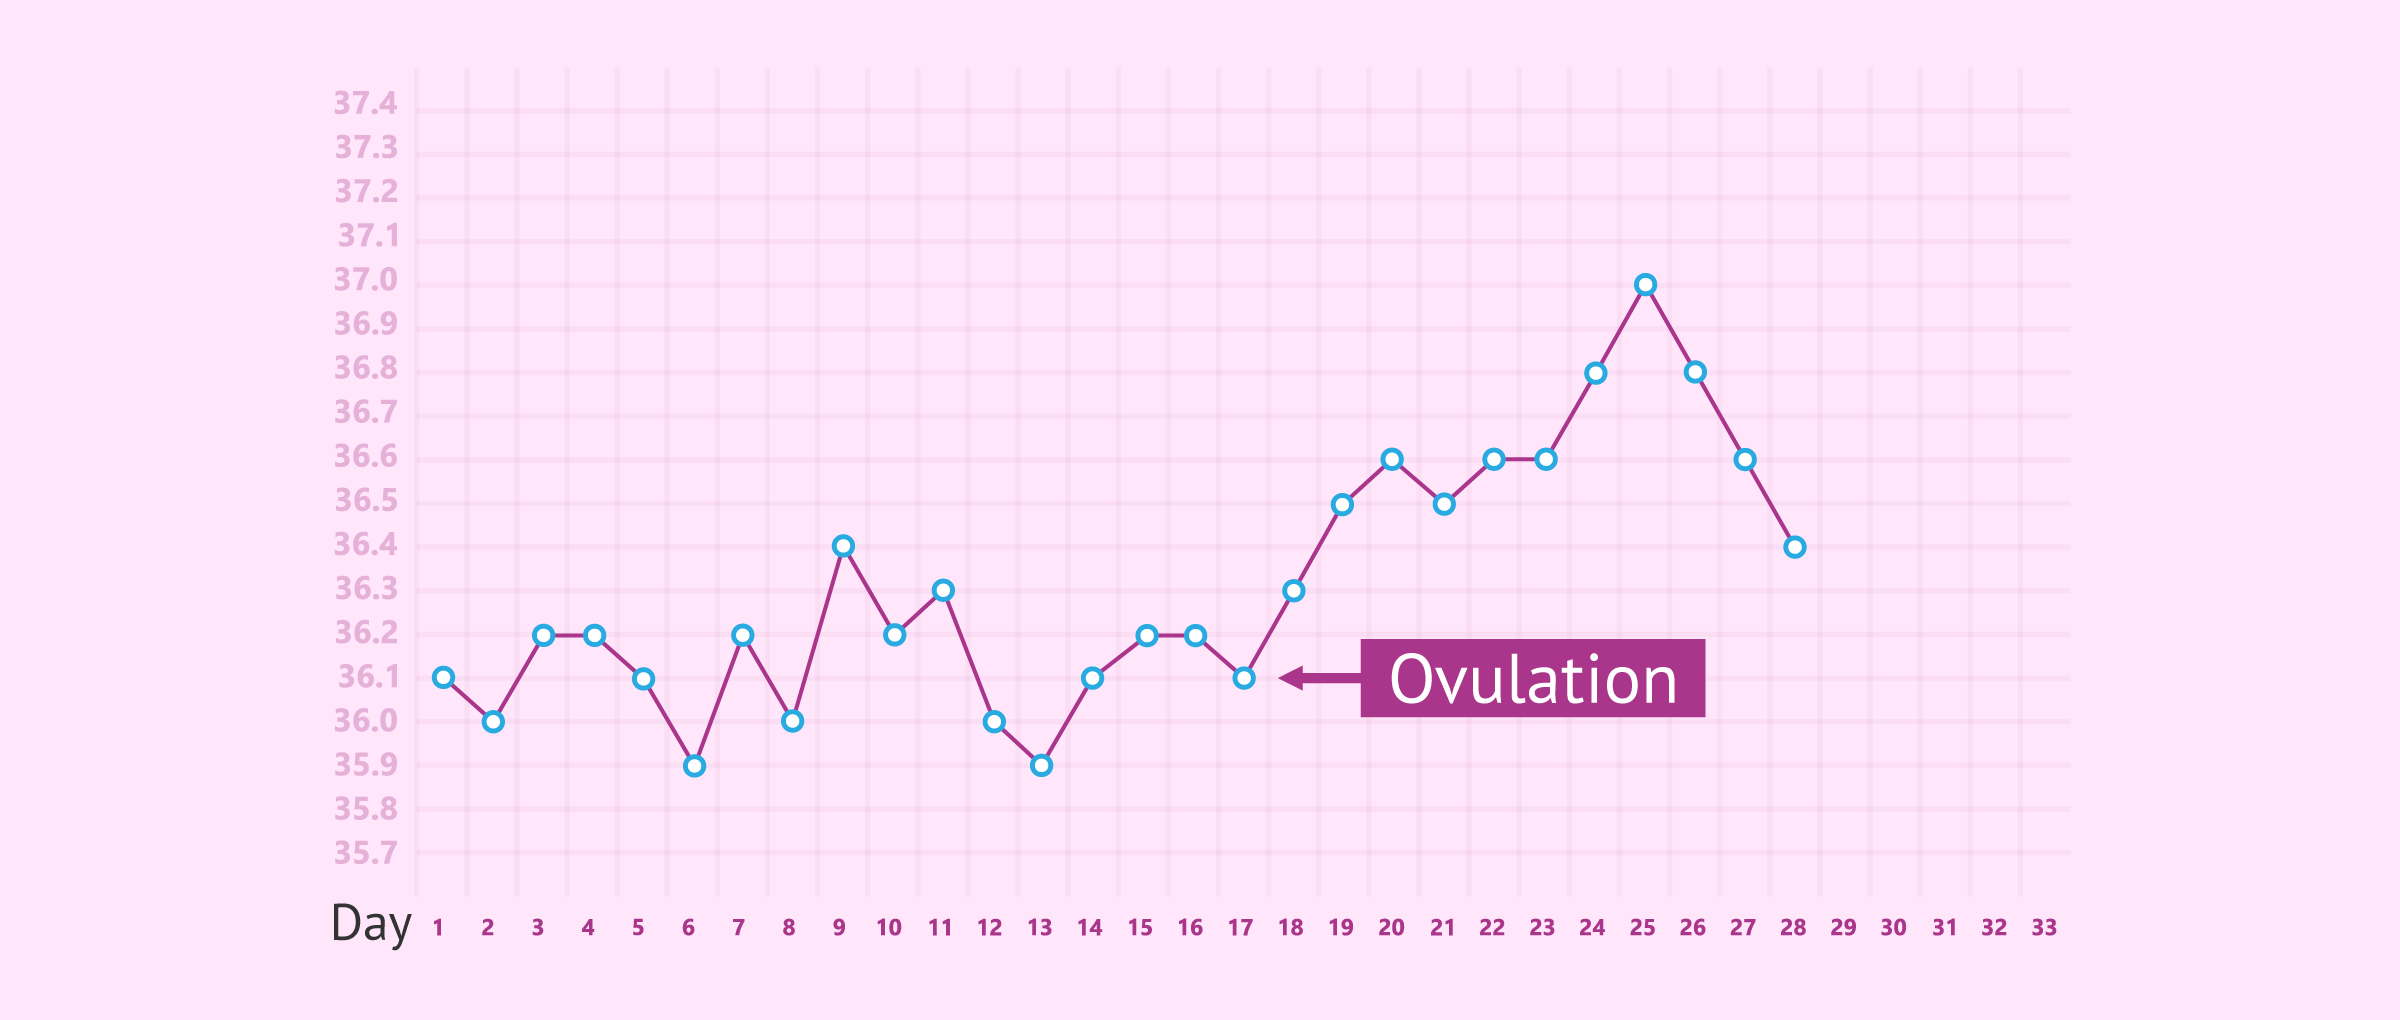
To follow the basal temperature method and try to increase the chances of achieving pregnancy, the woman should write down each morning her basal temperature on a chart like the one shown in the image.
It is preferable to use a sheet with a grid, in which the temperatures are placed on the vertical axis and the days of the menstrual cycle on the horizontal axis. However, there are templates that women can easily find and even mobile applications.
Each day, starting on the first day of the menstrual cycle, the woman should record her basal temperature with a dot. At the end of the menstrual cycle, all the dots should be connected, which will make it easier to see the increase in basal temperature.
The basal temperature has an increase of about 0.3-0.5°C once ovulation has occurred, during the luteal phase of the menstrual cycle and, if a pattern can be established after several menstrual cycles, the woman will be able to estimate when this increase will occur, ovulation and her most fertile days.
